Reporting & data analysis provides insight in to your business
Sales reporting removes uncertainty from business decisions by providing a clear picture of your company’s status at each stage of the sales process. By concentrating on quantifiable tasks with measurable results, you can increase the value of each salesperson and the company as a whole.
You can have data without information, but you cannot have information without data
Our exclusive visual reporting system, dubbed “visionboards,” is critical for developing effective sales strategies, tracking the effectiveness of your sales & marketing teams, & offering insight into where your organization excels and where it struggles.
Closing ratio, or close rate, is a metric that indicates the effectiveness of a sales professional or a sales team.
Customer acquisition cost (CAC), also called the fully loaded CAC, is the cost related to acquiring a new customer.
Customer lifetime value is the total worth to a business of a customer over the whole period of their relationship.
Retention rate is the percentage of customers who continue to pay for a service over a certain period.
Cost per Lead measures how cost-effective your marketing campaigns are when it comes to generating new leads.
Sales velocity is a widely used sales pipeline metric that indicates how quickly your company generates revenue. The more money your company can generate in the shortest possible time frame, the better.
Return on investment (ROI) is a financial performance metric that is used to determine the efficiency or profitability of an investment or to compare the efficiency of many investments.
Gross profit margin is a financial indicator that analysts use to determine a company’s financial health. It is calculated as the amount of money left after deducting the cost of goods (COGS).
Business analysis is the discipline that focuses on finding business requirements and resolving business challenges, questions, opportunities, and/or difficulties.
We support you in identifying and analyzing business opportunities and challenges; examining and documenting business processes; gathering, documenting, and analyzing requirements; assessing and choosing solutions to these problems; and aiding in their implementation.
Energy Sector helps clients identify and capture the most value and meaningful insights from data, and turn them into competitive advantages.
Our data analyst professionals have extensive industry and technical experience as well as a thorough understanding of the underlying economics, customer demands, and competitive dynamics of the energy sector. We help clients get insight and make a difference by offering a variety of customizable support options, including ad hoc, fundamentally transformative, and continuous analytics architecture and solutions. We do this by providing insightful data dashboards we call “vision boards”.
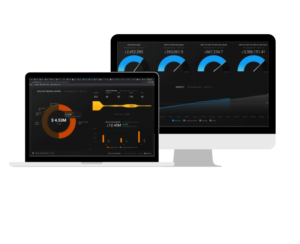
Dashboards are being adopted by an increasing number of enterprises as a means of swiftly comprehending and analyzing their data. Visionboards are a visual representation of the most critical information required to accomplish one or more objectives, consolidated, and arranged on a single screen for easy monitoring.
Our vision boards provide instant visibility into all essential indicators, ensuring that your energy sector business operates at peak efficiency. With data such as CAC (Customer Acquisition Cost), CLV (Customer Lifetime Value), Close Rate, and sales funnel values, it becomes much easier to identify your business processes’ faults and strengths.
Reporting & Analysis Packages
Our bronze reporting package includes:
- SEO reporting & analysis
- Setup & monitoring of Google Analytics
- Google tag manager for services/products
- Website conversion optimization
- 4 data visionboards with 4 data sources
Our silver reporting package includes everything in bronze plus:
- Fiscal year sales reporting
- Quarterly performance
- Customized sales performance metrics
- Cost of NEW Customer Acquisition (CAC)
- 9 data visionboards with 3 data sources
Our gold reporting package includes everything in silver plus:
- 90 day forecasting
- CRM data audit/management
- Month-End reporting
- Goal & quota progress measurement
- UNLIMITED data visionboards with 3 data sources
* It’s a full reporting & analysis department in a box!